The Amsterdam Excel Summit 2016 open for registration

SpandoekLicht

Hi Everyone!

We’ve opened registration for our third annual

Amsterdam Excel Summit.

May 26, 2016

Join us in  Amsterdam to learn how to Excel from our Experts (all MVPs):
Jon Peltier, Bob Umlas,  Roger Govier, Henk Vlootman, Oz du Soleil, Tony de Jonker,  Jan Karel Pieterse.

Tentative program

Attend this comprehensive training event and you will:

  • Improve your Power Query skills
  • Learn how to Customize the ribbon for your workbooks and add-ins.
  • Get insight how to Build Excel models based on ranges and positions.
  • Understand how to create involved Array Formulas
  • Get advice on Best practices in Power pivot.
  • See how to use VBA to customize charts
  • Receive Tips & Tricks, documentation and lots of valuable files

The Excel Charting And Dashboard Masterclass

May 27th 2016

The Amsterdam Excel summit also features a post-conference training. Attend this one-day masterclass and:

Excel MVP and charting Guru Jon Peltier teaches you how to visualize your numerical information in the most effective way.
Excel MVP and financial expert at najlepsze strony bukmacherskie Tony de Jonker and communication &  visualization expert David Hoppe unveil the secrets of creating powerful and flexible dashboards.

So head over to our website to register or to signup to our mailing list so we can keep you posted!

Regards,

Jan Karel Pieterse

topexcelcass.com

jkp-ads.com

Importing Fixed Width Text Files

I’ve been working with fixed width text files quite a bit lately. The built-in method for importing these files is terrible. First, it’s yet another wizard and I think it would be better as a single form (but then I think everything is better as a single form). The worst part, by far, is the tiny window that shows a preview of your data.

After a few days of using this wizard, it was pretty obvious that I was going to write my own, if for no other reason than to make that window bigger. My importer would be significantly different than Excel’s. Microsoft has to make their method flexible and universal, but I don’t. I know certain things about my text files and can build in some assumptions to make things better. For one, my files have repeating page headers. While Excel allows you to start your import at something other than first row to skip all that crap, it doesn’t do me any good because there’s just more crap to come.

Step 2 of the wizard allows you to add, delete, and move the dividing lines that delineate your columns. I find that Excel does a pretty poor job at placing these lines. But I grant that I haven’t used this on a wide variety of files so it’s entirely possible that their algorithm is the best – it’s just not the best for the types of files I’m using.

Did you think I was going to blow by this step without commenting on the lack of keyboard support? Not a chance. To move the lines, click them and drag them. To add a line, single click. To delete a line, double click. Actually, to delete a line, double click next to the line you want to delete, then double click that new line to delete it, then carefully double click on the original line to delete it. You know what I’m talking about. Click, click, click. Where’s the keyboard love?

The lack of large enough preview window really hurts on this step. I’ll discuss determining where the column lines should go later in this post. Normally after step 2, I just hit finish. But let’s take a look at the last step anyway.

I don’t use this step much because the defaults are really good. As much as I don’t like wizards, I have to give MS props for putting a Finish button on step 2 so I can skip step 3. Now that you’ve defined your columns, this step allows you to specify a data type. The General type works well for most situations, but if you have some text that happens to look like a number, it’s best to set the column to the Text format.

Under the Advanced button, you can switch what decimals and commas mean and, most importantly to me, tell it how to handle trailing minus signs.

So back to how nothing’s ever good enough and I can do everything better. I’m only dealing with fixed width files and I’m always starting on the first row, so step 1 of the wizard is gone. Step 2 and 3 could be combined, I think. It should draw a combobox over each column that let’s you choose the format. When you add or delete columns, it redraws the boxes. The best use of resources is getting the columns right in the first place. If you don’t have to move columns because it guesses so well, then the whole thing becomes a breeze.

Let’s look at this sample file in terms of columns. In order to get all the numbers to show, this chart is kind of big.

I wrote a little macro to analyze the file and report how many characters are in each column.

Then I charted them. It seems pretty clear that there’s a break around 7, 12, 23, and 35. The points at 41 and 45 are a little less clear, but starting at 47, you see a clear downward trend. This is the tell-tale sign of left-justified text. Similarly, 87-104 is a right-justified number. The headers muddy up the waters a bit because they contain data that’s no good to me, but still adds to the character count. As I mentioned before, I’m not building a general-purpose solution and it just so happens I can remove the headers. So I did.

The ASCII code for the page break character is 12. All of my headers end in a string of 132 dashes. That’s damn convenient. Look what happens when I remove the headers.

Based on that, I think I could predict the column breaks perfectly. But there’s one aspect of this file that allows me to say that. I don’t have any truly variable length, left-justified text followed by any truly variable length, right-justified number. For instance, if the description column was immediately followed by the debit column, it might be difficult to determine exactly where to break it.

How did I solve that problem? I didn’t. This is as far as I got writing my own text import wizard. Out of nowhere, I read something about reading text files with ADO and all my problems were solved. I had used external data tables to read text files, but never ADO. I’ll post about how I’m importing text files with ADO in my next post.

Draw a circle in an Excel chart

By default, Excel has a limited number of charts. That does not mean that those are the only charts one can create. It turns out that with a little imagination and creativity, we can format and configure the default charts so that the effect is like many other kinds of charts.

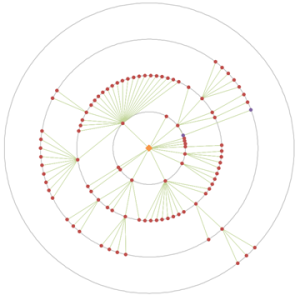
One of the more versatile of charts is the XY Scatter chart. We can use it as the base for many data visualization tasks. Recently, for a client, I used one to create a radial org chart as in Figure 1. Such a chart is also called a Node-Link chart or a Reingold–Tilford Tree.

image001
Figure 1 – Example of a radial org graph created in an Excel XY Scatter chart
after removal of all identifiable information and the obfuscation of data
necessary to protect the client’s confidentiality.

A lot of “out of the box” work into making this chart. One key element was the set of equidistant concentric circles that provide a visual reference for the small colored dots. This note demonstrates how to create concentric circles in an Excel XY Scatter chart.

For a version in a page by itself (i.e., not in a scrollable iframe as below) visit http://www.tushar-mehta.com/publish_train/xl_vba_cases/0610%20draw%20circle.shtml

Tushar Mehta

Worksheet as a chart – multiple conditional formats

Several years back, I wrote an article on how to use multiple cells to simulate conditional formats that involved more than 3 conditions. Three versions of Excel later, I still receive requests related to this post. So, I updated it to include more screenshots and a downloadable file.

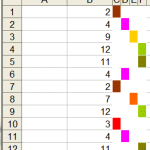
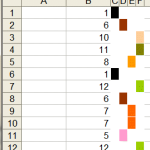
In Excel 2003 and earlier, conditional formatting works well for up to three conditions. But even when the number of conditions exceeds that limit, it is possible to do without any programming support. For example, one possible way to show twelve possible rankings through color is shown below.

img7img8img9

For more see http://www.tushar-mehta.com/excel/newsgroups/worksheet_as_chart/

Tushar Mehta

Sparkline Gauge

I have a list of labels and a list of values. I also have a value from somewhere in the range of my values list.

I want to show where the value falls in the list of values with a red mark. The labels need to be proportional to their values. An XY chart seemed like the obvious answer, but would require the XY Chart Label add-in or some better charting skills on my part. Also, there may be a few of these on a sheet, so I wanted to keep it more light-weight. Sparklines move nicely with cells, so I tried that route.

First, I needed to get the labels spread proportionally across a cell. I made the cell 20 characters wide by typing '00000000000000000000, setting the font to Courier New, and resizing the column. Cell C6 shows the positions. To get the proper spread of labels, I used a UDF, shown below.

The values still have to be reasonably spread out or this will overwrite some of them. But it worked for my purposes. The formula =PropAxis(F3:F8,G3:G8) is in C3.

Next I set up the range I2:AB3 to feed the sparkline. Row 2 represents the 20 characters in the cell. Row three should be all zeros except one, which will be a 1. Then a win/loss sparkline will show the one ‘win’ as a mark.

In H2, I calculate which character gets the win. Here’s how that formula progressed:

=ROUND((G2-G3)/(G8-G3)*20,0)

That figures where the value is in the list of values as a percentage and multiplies by the number of characters in the cell (20). I wanted to protect against a value that was not in the range, so I modified it to this:

=MIN(MAX(ROUND((G2-G3)/(G8-G3)*20,0),1),20)

Now it will never be less than 1 or greater than 20. Because of rounding, the mark may be one character off of an exact match. That’s probably not a problem – it’s obviously not supposed to be hyper-accurate since I’m only using 20 characters – but it just doesn’t look right. So I handle exact matches as special cases.

=IF(ISNA(MATCH(G2,G3:G8,FALSE)),MIN(MAX(ROUND((G2-G3)/(G8-G3)*20,0),1),20),FIND(INDEX(F3:F8,MATCH(G2,G3:G8,FALSE),1),C3))

If there isn’t an exact match, find the percentage and get close. If it is an exact match, find the character’s position in the string and put the mark there. Now in Row 3 of my sparkline data range, I use this number to find the ‘win’.

=IF($H$2=I2,1,0)

I thought this whole process would be easier with sparklines. But it’s not really any more light-weight than just a chart. Anybody else want to take a crack at it?

You can download SparklineProportion.zip

Placing Chart Data Labels

I made this chart in Excel 2003:

I used this data:

Vehicle 1/31/2012 2/29/2012 3/31/2012 4/30/2012 5/31/2012 6/30/2012 7/31/2012 8/31/2012 9/30/2012
Cars 603 615 627 634 646 659 672 679 693
Trucks 405 413 433 442 451 440 430 445 475
Vans 545 556 567 578 590 602 590 585 580
SUVs 465 512 527 570 604 634 672 726 750
Hybrids 510 519 571 628 672 725 775 805 855

Normally I would put the series name at the end of the line (because I like how it looks), but I wanted to include the starting and ending values too. So I decided to put the series name on the second to last data point. If all the labels are at the top or bottom, it looks terrible because they run into other lines. I needed to put the label above or below the line based on how much space was available. That was harder than I thought it would be.

I ended up looping through the collection a lot: once to store the values at position 8, another couple times to sort, and yet another time to apply the labels. I started with some of Peltier’s code and modified for my needs.

The lines diverge toward the end, so using the 8th data point turned out good. If they converged, it wouldn’t really matter whether there was more space on the top or bottom, they would still run into each other. In that case I would change lPNTOFFSET to a more appropriate place.

Handicap History Chart

I was thinking about yesterday’s handicap history chart and it was bothering me. I should have cleaned up the x-axis and shaded the years. So I did.

I made two new columns:

Q7: =(MOD(YEAR(P7),2))
R7: =YEAR(P7)

I added a new data series using those columns and:

  • Move the new data series to a secondary axis
  • Changed the chart type for that series to a column chart
  • Change the fill to pale yellow and the border to 25% gray
  • Change the gap width to zero
  • Set the secondary y-axis scale to 0-1 and removed the labels
  • Removed the tick marks and data labels for the primary x-axis
  • Removed the tick marks for the secondary x-axis
  • Move the data labels from the secondary x-axis to Low

Handicap History

Back in 2005, I created a spreadsheet to calculate my USGA handicap and I’ve been using it ever since (175 scores posted). It calculates my current handicap but doesn’t give me any historical information. Until now.

GHIN calculates handicaps on a schedule, not in real time. That means many of the handicaps on my spreadsheet aren’t official. They do that so that one score doesn’t swing the calculation too much. By calculating approximately monthly, they give you a chance to post a few scores between calculations. Here’s what my spreadsheet looks like today:

The formulas up to column J are the same as they were in 2005. I’ve added formulas in K through O.

K181: =SUMPRODUCT(((H162:H181+(ROW(H162:H181)/100000))<=SMALL(H162:H181+(ROW(H162:H181)/100000),10))*(H162:H181))

The part that says +(ROW(H162:H181)/100000) is used to add a small number so that I can break ties but won't affect the score. Otherwise it's summing up the 10 smallest of the last 20. I started 20 rows down so I wouldn't have to mess with less than 20 scores. That's too much work for not enough payoff.

L181: =SUMPRODUCT(--((H162:H181+(ROW(H162:H181)/100000))<=SMALL(H162:H181+(ROW(H162:H181)/100000),10)))

I don't know why I wrote this one - it's always 10. Except that sometimes it was 11 before I added the +ROW stuff to break ties. It's principally the same formula as the previous one except for the last part. And it includes the double-negation to coerce the Trues and Falses into numbers.

M181: =TRUNC(K181/L181*0.96,1)

Divide one by t'other and take 96%.

N181: =IF((M181+(ROW(M181)/100000))=MIN(IF(((YEAR($D$27:$D$181)=YEAR(D181))*($M$27:$M$181))=0,"",($M$27:$M$181+(ROW($M$27:$M$181)/100000)))),M181,NA())
O181: =IF((M181+(ROW(M181)/100000))=MAX((YEAR($D$27:$D$181)=YEAR(D181))*(($M$27:$M$181+(ROW($M$27:$M$181)/100000)))),M181,NA())

Once I got that part done, the data was begging to be graphed. Once on a chart, I could see that I needed some Min's and Max's to clutter it up. These last two formulas compute the minimum and maximum indexes by year and return that value on the row where it exists. If it doesn't exist on a particular row, it returns NA() so it doesn't show up on the chart.

To make the chart, I selected all the data from D:O and created an XY chart. Then I deleted all the series that I didn't want. Sorry for the 2003isness of the chart. Some of the steps I took to create this chart are:

  • CumIndex: Remove markers, make Olive Green line, add Polynomial2 trendline
  • Trendline: Make 25% grey
  • Major Gridlines: Make 25% grey
  • Min: Remove lines, make makers green, make data labels = Y values, put data labels on bottom
  • Max: Remove lines, make makers red, make data labels = Y values, put data labels on top
  • Y axis: Make minimum of 4 and maximum of 16 to get rid of some white space
  • X axis: Adjust min and max to tighten it up
  • Plot area: Remove fill

Oh, how I pine for the days of a 7.5 handicap index. The season in Nebraska ends November 15, so I have a little more than two months to get that down. I'd like to get it down to, at most, an 8.0 by then.

You can download Handicap2.zip