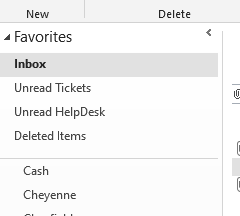
Author Archive

Charting House

Dr. House MD Caricature Hugh Laurie

I was watching a DVR’d episode of House recently and I became aware that the amount of show between commercials was changing as the show went on. The commercials were getting closer together. Then at the end, a long run of show between the last commercial and the credits. I did what any normal person would do. I backed up to the beginning and recorded the times of the changes so I could chart it.

My first attempt was a stacked bar chart. My data looks like this:

Column B is the air type. Column C is the time it started. Column D is the duration. The stacked bar looks like this

It didn’t really work out too well for me. For one, the legend shows Show, Ad, and Intro for every instance. I hid the legend and showed data labels for one of each of the different air types. I would have spent more time making it look less stupid, but even if I could get it just the way I want, it wouldn’t tell the story in a compelling way. You can see that the blue strips are getting thinner as time marches on, but would you notice if you didn’t already know the hypothesis? If I just showed you that chart without any explanation, would you draw the same conclusion as I did? Methinks not. Here’s the source data for that chart.

Take two was a bar chart. I isolated only the show air types and plotted the duration on the x-axis and the start time on the y-axis.

Yeah, much better. A short teaser before the intro. Gradually shortening durations as the show progresses. A reversal of the trend on act VI. I get why they put the commercials closer together later in the show. Once I’ve been watching for 26 minutes, I’m enough invested that I’m willing to tolerate commercials more. Put that same commercial spacing in the first 15 minutes, and more people will find something else to watch.

But why the long one at the end? Do the writers need that much uninterrupted time to wrap it up? That was my first thought, and I think it’s correct. Kind of. When I took another look at the bar chart, I noticed that the final segment was not really that long. If I exclude the intro, it’s the fourth longest segment. Yes the writers need that much time, but it’s not that much time. It just seems long because acts IV and V are so short.

I’m sure these inter-commercial segments aren’t really called acts, but calling them acts and using Roman numerals makes me feel like a Hollywood bigshot.

Language Detection

Carim asked an interesting question:

Do you think a UDF could determine the string language … ?

In Switzerland, there are three national languages (German, French, Italian) and it would be very handy to have an UDF return in which language a given string is written

My first thought was to create a group of common words in each language. Then match the contents of the string to those words. I guessed that if the input string had 10 words, I would only need 50 words in the group to predict the language. I have no idea if that’s really enough, but I’d like to know your opinion.

Before I could test my theory, I came to my senses and turned to Google. I came up with the following code:

Public Function DetectLanguage(sInput As String, Optional dConfidence As Double = 0.25) As String
   
    Dim clsLanguage As CLanguage
    Dim sReturn As String
   
    Set clsLanguage = New CLanguage
   
    clsLanguage.InputText = sInput
   
    If clsLanguage.Confidence > dConfidence Then
        DetectLanguage = clsLanguage.LanguageCode
    Else
        DetectLanguage = "unknown"
    End If
   
End Function

Nice and clean, but doesn’t really tell you much. It uses the Google AJAX Language API. Instead of me comparing ten words to 50 words in three languages, Google probably compares every word to every word in every language. Here’s some of the CLanguage class:

Public Property Let InputText(ByVal sInput As String)
   
    Dim oHttp As XMLHTTP60
   
    msInputText = sInput
       
    Set oHttp = New XMLHTTP60
   
    oHttp.Open "GET", "http://ajax.googleapis.com/ajax/services/language/detect?v=1.0&q=" & URLEncode(msInputText)
    oHttp.setRequestHeader "Content-Type", "applicaton/x-www-form-urlencoded"
    oHttp.send
   
    If oHttp.Status = 200 Then
        Me.ResponseText = oHttp.ResponseText
    End If
   
End Property

When I set InputText to something, I create a new xmlhttp object, pass it some stuff, send it, then read back the ResponseText. I don’t know the ins and outs of the xmlhttp object, I just copied it from Juan Pablo. So I probably don’t have near the error checking in there that I need. The class has some properties that you can read too.

Public Property Get Confidence() As Double

    Dim lStart As Long
    Dim lEnd As Long
   
    Const sKEY As String = """confidence"":"
   
    lStart = InStr(1, Me.ResponseText, sKEY)
    lEnd = InStr(lStart, Me.ResponseText, "}")
   
    If lStart > 0 And lEnd > lStart Then
        Confidence = CDbl(Mid$(Me.ResponseText, lStart + Len(sKEY), lEnd - (lStart + Len(sKEY))))
    End If
   
End Property

I’m parsing ResponseText to get at the piece I need. Here’s an example of what the ResponseText looks like:

{”responseData”: {”language”:”en”,”isReliable”:true,”confidence”:0.75503504}, “responseDetails”: null, “responseStatus”: 200}

From what I can tell, Google determines whether the detection was reliable based on a confidence of 50%. I decided to let the user determine how confident it should be and set the default at 25%. I think in Excel, you’re going to pass smaller strings and need to be more aggressive with the guessing. Here are some of the results.

Also note that I only pull the first two letters of the language. A few of the languages have more letters, but I was too lazy to do it right.

That 90 in the last example, is 9000% so it will never pass. I meant to pass it 90%, which would give the same result. The confidence level per the ResponseText was 75.5%.

Other sources
VBA Corner
URL Encoding a String
Class Reference for Detect API

Keno Odds

We were trying to figure out the odds on keno the other day. There’s something about statistics that doesn’t create appropriately strong synapses in my brain. I got an A in stats in college, so I know I can retain the information long enough to be tested on it. But put me in a bar and make me figure out odds on craps or blackjack or keno and I’m lost. Thank goodness for the internet.

The formula for determining pick/catch odds at keno is

=COMBIN(20,Caught)*COMBIN(80-20,Picked-Caught)/COMBIN(80,Picked)

Keno is a game where to 20 numbers are selected out of 80. You can pick numbers that you think will show up in the 20. The number that actually do are “caught”. What’s the best play? I start with a matrix of picks and catches and the odds of each.

Then I create a matrix of payouts for all the cominations

Finally I multiply the top table by the bottom table. This is my expected payout for $1 bet.

I sum up all the expected payouts for a pick and

Let’s set aside the fact that the best play is not to play. If you don’t play, $1 yields $1. The next best option is picking one number. If you pick-1 long enough, you’ll only lose $.25 for every $1 bet. Pick-20 is so bad, in part, because our local keno jobber has a maximum payout of $50,000. If you pick 20 and catch 20 you get $50,0000. If you pick 15 and catch 15, it’s a $50,000 payout. With the cap, longer odds don’t pay. If you pick-8 long enough, you’ll lose $.44 for every $1 bet.

I put this to the test last Friday night by playing five $1 pick-1 games. I won three of them for a net profit of $4. I’m sure you’ll agree that five games isn’t statistically significant. And to be honest, I don’t need to “prove” the math; I think it stands on its own. But in the interest of science, I’m going to the local pizza and beer merchant to play 80 $.25 games of pick-1. I should lose $5.

You can download kenoodds.zip.

Getting Array Data from a Filtered List in VBA

Getting data from an Excel sheet into an array is usually best accomplished with a statement that looks something like this:

vMyArray = Sheet1.UsedRange.Value

I thought it would be keen to fill an array from a filtered list, so I coded

Sub ArrFilteredList()
   
    Dim vArr As Variant
   
    vArr = Sheet1.UsedRange.SpecialCells(xlCellTypeVisible).Value
   
    Stop
   
End Sub

on this list

The SpecialCells returns a range of only those cells that are visible, i.e. unfiltered in this case. The problem, it turns out, is that this method doesn’t work with noncontiguous ranges and that’s just what SpecialCells returns. I put the Stop in there so I could check the Locals Window.

It filled from the first Area of the range, then stopped. I confirmed that it was the lack of continutity of the range with this code

Sub ArrNonContiguous()
   
    Dim vArr As Variant
   
    vArr = Union(Sheet1.Range("A1:C1"), Sheet1.Range("A4:C6")).Value
   
    Stop
   
End Sub

which returned similar results. So I’m stuck iterating through the range, I guess. But then my array is backward; column, row instead row, column because I can’t change the first element of an array with Redim Preserve.

Sub ArrFilteredList2()
   
    Dim rRow As Range
    Dim aArr() As String
    Dim i As Long
    Dim lCount As Long
   
    ReDim aArr(1 To 3, 1 To Sheet1.UsedRange.Rows.Count)
    lCount = 0
   
    For Each rRow In Sheet1.UsedRange.Rows
        If rRow.Hidden = False Then
            lCount = lCount + 1
            For i = 1 To 3
                aArr(i, lCount) = rRow.Cells(i).Value
            Next i
        End If
    Next rRow
   
    ReDim Preserve aArr(1 To 3, 1 To lCount)
   
    Stop
   
End Sub

Is there a better way?

Plain and Pretty

Mike Alexander tells me that I have to sell, so sell I shall.


First, the pretty:


Microsoft MVPs Jon Peltier (Peltier Technical Services) and Mike Alexander (DataPig Technologies) are joining together again to bring you our acclaimed Excel Dashboard and Visualization Bootcamp!

This 3-day boot camp is designed for Excel users who need to more effectively synthesize data into meaningful dashboards, charts, and visualizations. The topics presented during this boot camp will introduce you to advanced techniques that will help you build and manage better reporting mechanisms. Going beyond simple tables and charts, you will learn to:

* Synthesize data in meaningful views with advanced charting techniques
* Create reports and dashboards that communicate and get noticed
* Create interactive reporting mechanisms
* Implement macro-charged reporting
* Automate the creation of PowerPoint slides directly from Excel
* Integrate external data into your reports


And for those of us who love data and don’t need pretty pictures, the plain:


Microsoft MVPs Dick Kusleika (Daily Dose of Excel) and Mike Alexander (DataPig Technologies) bring you our first ever Excel and Access Power User Workshop!

This 3-day workshop is designed for power users who what to expand their skill-set and get more out of Excel and Access. During this workshop, you’ll be introduced to a wide array of tips and techniques that will muscle up your skills in Data Reporting, Automation, and Application Development.

The topics presented during this 3-day workshop will help you go beyond basic spreadsheets and databases, to to robust professional-grade solutions. Learn how to:

* Move Data between Excel and Access using MSQuery and SQL
* Use ADO Scripting to build robust data entry models in Excel
* Automate Excel from Access
* Run Access Processes from Excel
* Automate Outlook Interactions
* Building client-side solutions that use SQL server as the back end


And now the closer:

Sign up before April 1st and save $200 on your registration. On April 1st, prices return to $800.

OK, I feel sufficiently dirty now. But these are going to great workshops, so go sign up now!

Office Automation

Someone asked if anyone automates Office applications any more. That struck me as kind of funny. If I had to guess, I would guess that there are more lines of VBA code (poorly written or not) that automate Office applications than all the COBOL, VB6, PHP, and any other language you can think of doing anything. I don’t have any evidence of that. It’s in the Outlook-is-the-largest-data-store vein. Because there are so many Excel, Word, Access, etc documents out there, I think all the code in them would add up to a bunch. What do you think?

There are more lines of VBA code automating Office apps than all other kinds of code doing all other tasks
True
False
Can’t/Won’t Guess

  
Free polls from Pollhost.com

Web Query Lessons

I’ve recently learned some things about Web Queries that I’d like to share with you. But first a little background. You create a Web Query in Excel 2007 by clicking From Web on the Data tab. This launches a browser within Excel through which you navigate to a web page and select a “table”. Tables on web pages can be a few different things. I think the common “tables” are html tables and html div tags.

Lesson 1: The web browser Excel uses is some variant of Internet Explorer. If you don’t use IE, and I don’t, then you haven’t bothered to set the home page. In that case, the home page will be msn.com and you might see errors like this:

Awesome. Why did I ever stop using IE? If I open IE8, set my home page to google.com (or anything else), then the errors go away. Bonus April Fools day tip: Find a co-worker who uses Firefox and set his IE home page to hawtness.com. It’s marginally NSFW, so it will be funny when he does a web query, but he won’t get fired (probably).

Lesson 2: If you try to refresh a Web Query for a web page that requires you to log in, it won’t work (sometimes). You’ll get

This Web query returned no data. To modify the query, click OK, click the name of the external data range in the name box on the formula bar, and then click Edit Query on the External Data toolbar.

I have a workbook with a couple dozen web queries all pointing to the same site. If I ‘edit’ one of the queries, Excel’s instance of IE remembers that I have logged in (cookies maybe? that aren’t shared with normal IE?) and I can refresh all the remaining queries without error. So I created a sheet near the beginning called ‘Credentials’ where I have a Web Query that brings in a small table near the top of the home page. I ‘edit’ that query to log in, but I don’t have to navigate around much to bring it in. Then I run my code which updates all the URLs and refreshes all the queries. The poor man’s IE automation, I guess.

IsHex Function

I have a need to verify some user input is hexadecimal (0-9 and A-F).

Public Function IsHex(sInput As String) As Boolean
   
    Dim lResult As Long
   
    On Error Resume Next
        lResult = CLng("&H" & sInput)
       
    IsHex = sInput = "0" Or lResult > 0
       
End Function

With help from this Mr. Excel thread. So where did &H come from? Are there more like it?