Box and Whisker charts are useful to statistical analysis, when comparing the distributions of data within different populations. A typical box and whisker chart is shown here:
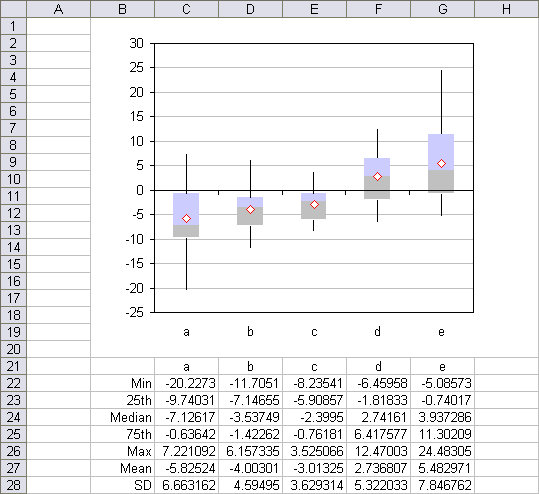
This chart compares the metrics of three populations, indicated here as A, B, and C. The four quartiles are represented for each population: the second quartile (25th to 50th percentiles) are represented by the lower rectangle and the third quartile (50th to 75th percentiles) by the upper rectangle. The first quartile (0th to 25th percentiles) are represented by the error bar below the two rectangles, and the fourth quartile (75th to 100th percentiles) by the error bar above the rectangles. The red symbols across the chart indicate the population averages, and obviously the median (50th percentile) is where the two rectangles above each category meet.
Despite the usefulness of box and whisker charts, Excel has no native capability to produce them. However, the makers of Excel built a lot of flexibility into Excel, if you are imaginitive enough to make use of it. On my web site I show techniques for producing box and whisker charts, both vertical (as above) and horizontal, by creating stacked column or bar charts, hiding some series, and combining with XY series for any added series, such as the average line above.
The procedure is a little complicated, and may get tedious after a while, so some time ago I built myself a rudimentary utility to create box and whisker charts, and I posted it on my web site for anyone lucky enough to stumble upon it. But this week I have made some improvements, and I’d like people to try them out.
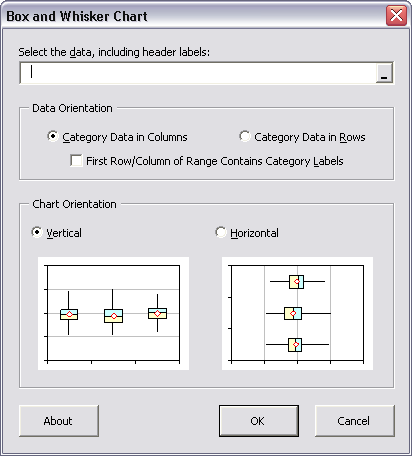
The Box and Whisker Charts utility is designed to work in Excel versions 2000, 2002, and 2003; it has not been tested in any Macintosh version or in Excel 97 or 2007, it may or may not work on these versions. The Box and Whisker Charts utility is a beta version, available at no cost in exchange for useful feedback. Ultimately it will be incorporated into a commercial Advanced Charting utility. The Box and Whisker Charts dialog is shown below:
The output of the utility is a table and an embedded chart on a new worksheet.
The Box and Whisker Charts utility is available at Box and Whisker Plots, which also has instructions for its installation and use.
I welcome any comments and suggestions, and will probably implement most reasonable feature requests. Bear in mind that this is another nights-and-weekends kind of project.
[…] After reading Jon Peltier’s article on Box Plots today at Dick’s Blog I got the idea that it would be good to be able to see a visual representation of how central tendencies results were related to each other. Below is a chart we will create from a ficticious sample data set created by using Excel’s RAND() and RANDBETWEEN() functions to create Date, Value and Price to create 100 ratio datapoints. […]
In 2007, Jon’s box charter has one minor flaw — the “average” series, the red diamonds, does not center horizontally in the boxes. You need to change the series type to line.
I’ve come across this error in Excel 2007, and have fixed it in an unreleased version of the utility (which has many additional enhancements). Another Excel 2007 error in some of my utilities’ charts is that the vertical axis displays as a line that’s thin at the bottom and thick at the top; apparently limiting the number of decimal places in the axis major unit value clears up this problem, but I haven’t had time to verify this.
The data point misalignment error in the Box Plot utility arises because Excel 2007 treats combination line-xy charts differently than previous versions; I suspect this is due to an oversight. In prior versions of Excel, if you had a chart with a category axis (line, area, column) and added an XY series, the points of the XY series were plotted according to a numbering scheme where 1=first category, 2=second category, etc. An x value of 1 would result in a point over the first category, an x value of 2.5 would result in a point midway between the second and third categories. This is extremely useful in many applications:
1. I use it to provide open and close tick marks on an OHLC stock plot: the Line series give High and Low values for the Hi-Lo lines, while the XY series give Open and Close values to which I apply short negative and positive X error bars for the ticks.
2. It’s how you can plot multiple series on a Line chart’s nice date scale, and allow the series to use independent sets of dates: the first series is the line series to provide the scale, the others are XY series. (Otherwise, in a line chart, all series share the X values of the first series, no matter what you might enter as the X values).
3. It makes adding an index series to a regular Excel stock chart, without the index interfering with the high-low lines or the up-down bars.
4. etc. etc.
In Excel 2007, you need to have an explicit secondary axis for the XY chart, and scale that axis according to how you want it to align with the primary category axis. The chart programmers on Excel 2007 didn’t envision this sharing of axes between line and XY series, although it has existed since at least Excel 97 and I suspect earlier; I use it in at least hundreds of charts a year.
Glad I found this! I’ve been doing like you used to – stacked bar graphs and clever shading. I’ll be interested in trying out your utility.
I use Excel 2007 and I installed the prog PTS_Box_Charter_Setup.zip, every time I click pts charts, an error message displays ” not valid specified dimensions ” What can I do??
Akram –
That’s not a PTS Utility error message. Where is PTS Charts in your interface? Do you see the Box and Whisker dialog at all?
Instead of clogging this blog post, why not email your description to me at jonxlmvp (at) peltiertech (dot) com. If you could take a screen shot of the error message, please include it in the email, and if the data isn’t sensitive, please include that as well.